
Our impact
Our mission and job as TAUW is to show that sustainability is the way forward and to help our clients create an environmentally healthy world that can sustain future generations. Over the past year, we further improved our internal operating procedures using new technology. More significantly, we applied innovative solutions to our services. In this section, we describe our handprint, footprint and highlight the meaningful contributions we made – and continue to make – to a vital living environment.

Enhancing impact: data intelligence solutions
In the dynamic field of environmental consultancy, digital transformation is not just a trend but a foundational shift in how we approach complex challenges, especially in urban planning. Here, diverse factors like soil, water, social, environmental, and economic considerations intertwine on a small yet significant scale. Digital technology enables us to tackle these challenges with greater speed, accuracy, and efficiency.
In 2023, we advanced significantly by enhancing our workflows and integrating data flows across spatial planning. This integration highlights the crucial role of human-computer collaboration, with our consultants leveraging technology to not only process data more effectively but also to ensure our solutions are sustainable, cost-efficient, and impactful.
Technology, particularly Artificial Intelligence (AI), offers unprecedented opportunities to amplify our environmental impact. From the MACE application for data-driven material flow analysis to AI-driven algorithms for ecological monitoring, these innovations exemplify our commitment to leveraging digital tools for a sustainable future. We also have our very own AI Assistant in a completely secure environment to assist us in our daily tasks, allowing our consultants to focus on the value-adding activities.
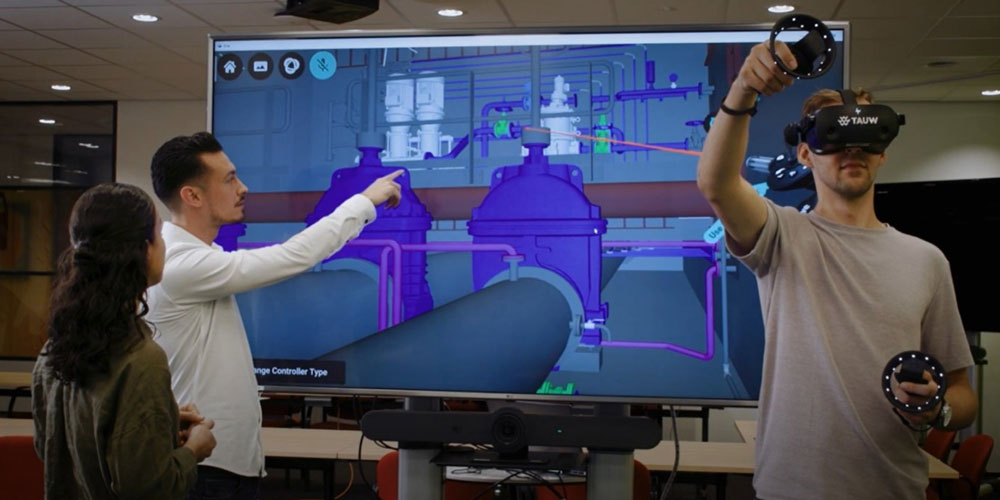

Our handprint: impactful solutions in our services
Our handprint is one of our greatest means of making an impact. We support our clients on their journey to reduce their footprint on the environment. Our objective as a European environmental consultancy is to promote sustainability on every project. We want to increase our contribution through the services we provide. If we want to take impactful decisions, we need to quantify our own footprint and handprint on the planet.
Monitoring impact
Therefore, we have started developing a method to measure our handprint while at the same time assessing our footprint, using the appropriate guidelines. We determine our handprint by two factors. Firstly, the sustainable outcome of a customer’s project. Secondly, TAUW’s effort to increase the positive impact on the client’s project by implementing it to be more in line with our mission.
At TAUW we want to know our impact and continuously improve and increase it. The method to demonstrate our impact has now been developed in broad terms and it is time to test the model by monitoring our impact on actual projects. That requires the necessary commitment and expertise in the field of data intelligence. We expect to be able to start monitoring our larger projects in 2025. Based on lessons learned we can then extend the method to other projects.
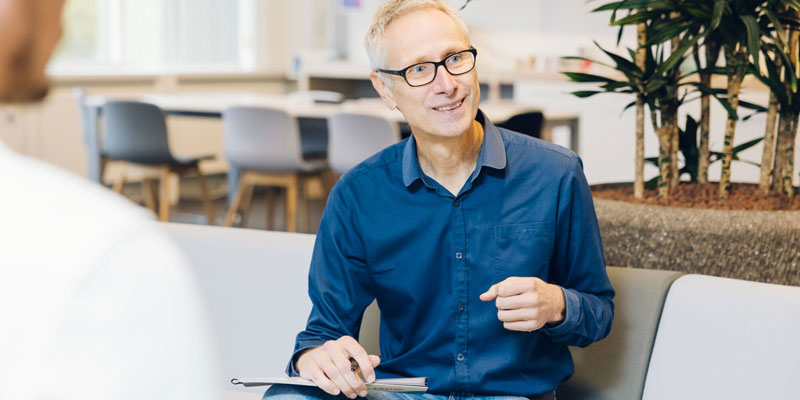
Leaving a positive handprint: our impactful projects
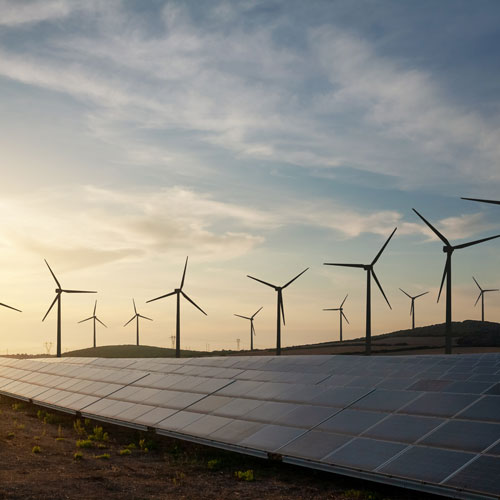
Sustainable Business Operations
Changing gears: roadmap to net zero
Client: Petronas Lubricants International (PLI)

Sustainable Business Operations
Consumer electronics geared to greater sustainability
Client: Lautsprecher Teufel GmbH
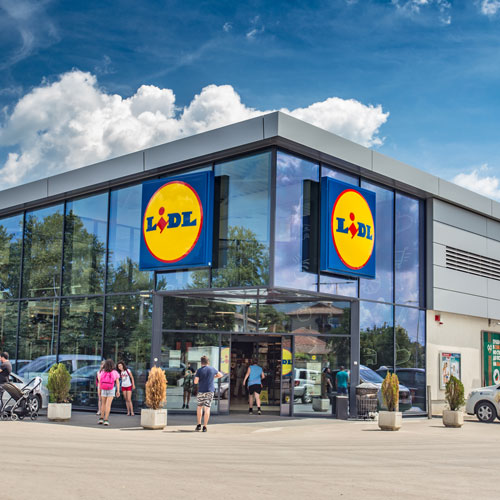
HSE Compliance & Business Continuity
Ensuring compliance for growth and renovation ambitions
Client: LIDL
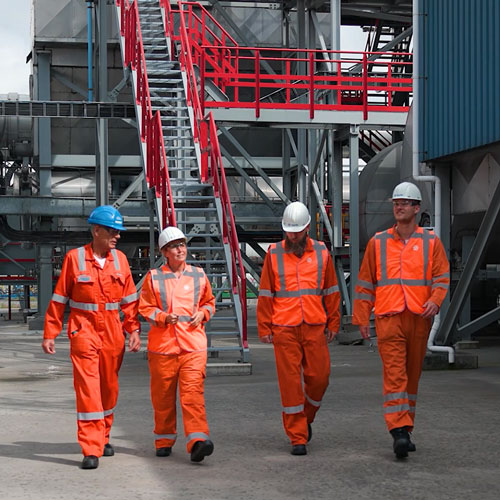
Future-proof Site (Re)Development & Transformation
Transforming the site to a Greenfield
Client: Aluchemie

Future-proof Site (Re)Development & Transformation
Nature based solutions for the remediation of contaminated soil and the restoration of soil functions
Client: Vermilion
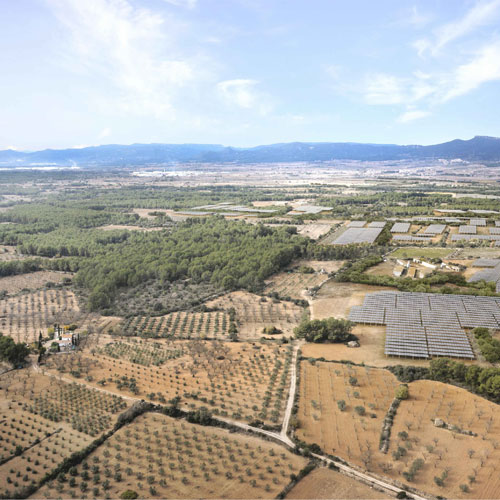
Future-proof Site (Re)Development & Transformation
Design of 82 MW Solar Power Plants in Tarragona
Client: IGNIS and ib vogt
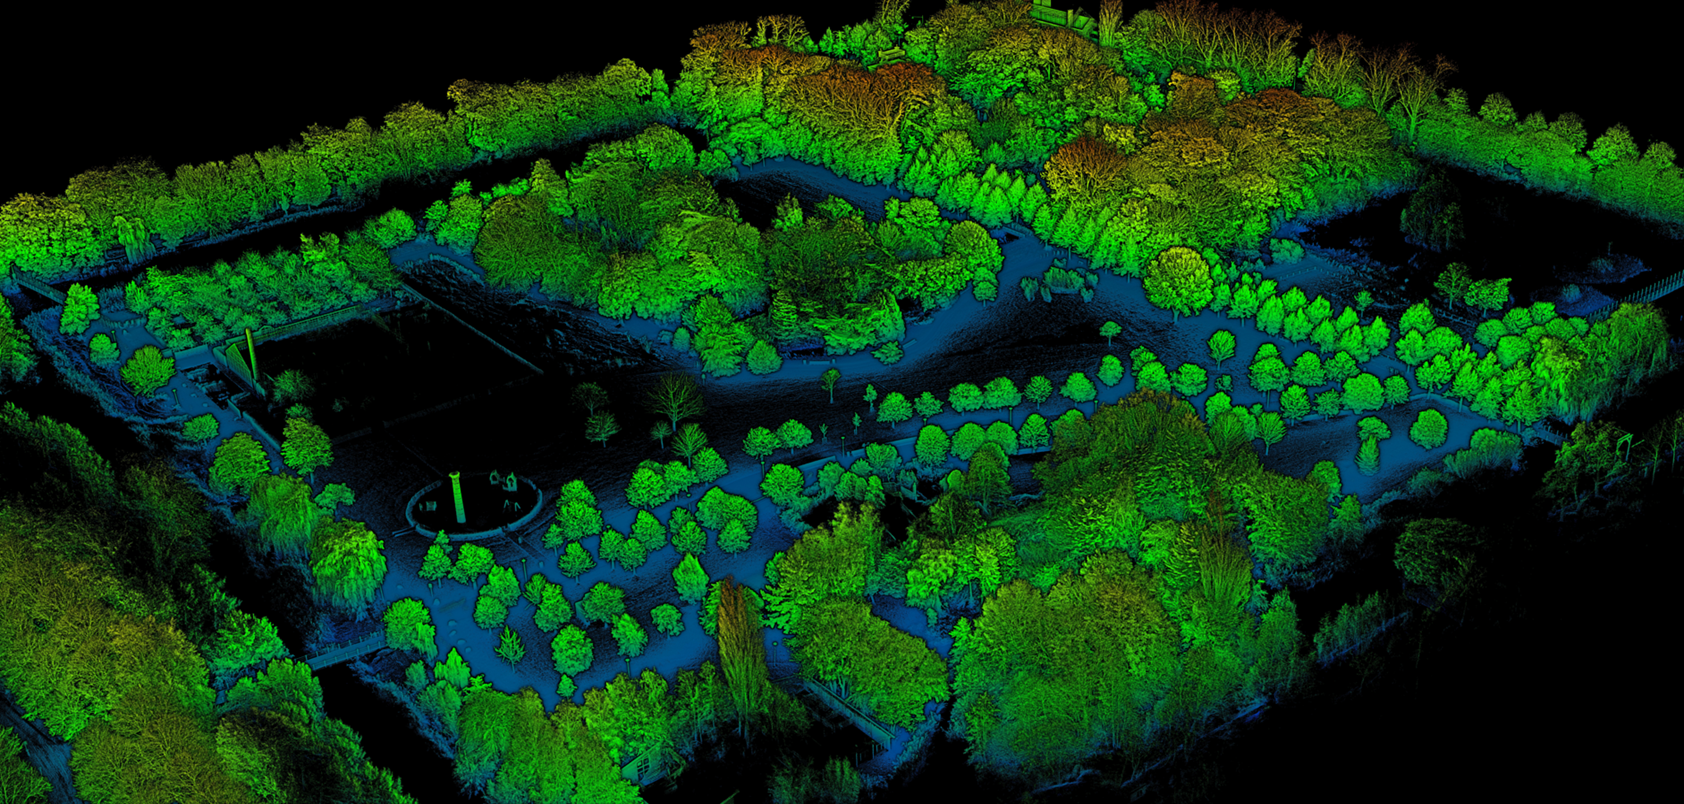
Data Intelligence Solutions
High-density point cloud algorithm to map trees in Amsterdam
Client: Municipality of Amsterdam
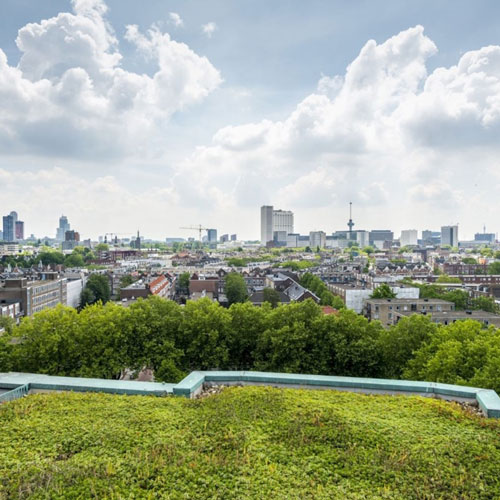
Transition Strategies for a Future-proof Living Environment
Green climate adaptive urban development standard
Client: Ministries of the Netherlands
Developing & Conserving a Resilient Living Environment
How rainfall models contribute to climate adaptation strategies
Client: City of Boizenburg
Our footprint: sustainable operations
GHG footprint monitoring
As dedicated professionals, we lead by example. And we take our commitment to reducing our carbon footprint very seriously. We report on our footprint using the Greenhouse Gas (GHG) Protocol. This is a corporate standard based on the Kyoto Protocol. It categorises the greenhouse gas emissions (GHG) into Scope 1, Scope 2 and Scope 3 emissions[i]. In line with the UN Sustainable Development Goals, we are committed to the sustainable use of materials and energy. In 2023, TAUW Group has also committed to the Science Based Target Initiative (SBTi) climate target of well below 1.5°C. In 2024, we will set our specific climate targets and work on our reduction plan for all TAUW entities to achieve NetZero as soon as possible.
[i] t CO2 e = tonnes of carbon dioxide equivalent
[i] Where available, market-specific emission factors were used in the calculation. We have not included GHG emissions from refrigeration gas losses this year, but will include them in our 2025 carbon footprint. Our digital data system, and that of our suppliers, used to calculate the GHG emissions of the entire TAUW Group value chain is not yet mature enough to provide the required granularity, so there is a degree of uncertainty in the data retrieved.

2023: 232 t CO2 e.
Scope 1 – Direct greenhouse gas emissions by TAUW Group
Scope 1 refers to direct GHG emissions from sources that are owned or controlled by the TAUW Group. These emissions result from activities such as the combustion of fossil fuels consumed by company-owned and/or controlled vehicles or equipment, as well as the combustion of on-site heating (natural gas) and electricity generation. We, as a company, are directly responsible for these emissions. The total Scope 1 emissions for the TAUW Group in 2023 were 232 t CO2 e.

2023: 282 t CO2 e l-based & 199 t CO2 e m-based.
Scope 2 – Indirect emissions from the use of electricity, heat and steam supplied by other companies
Scope 2 refers to indirect GHG emissions that are associated with the consumption of purchased electricity, heat, or steam by the TAUW Group which we use, for example, to heat our offices. These emissions result from the activities linked with the production of electricity and/or energy, i.e. outside of our direct control. The Scope 2 emissions for the TAUW Group in 2023 were 282 t CO2 e location-based and 199 t CO2 e marked-based.

2023: 21,731 t CO2 e.
Scope 3 – All other emissions associated with TAUW’s activities
Scope 3 covers approximately 97% of our GHG emissions. Scope 3 includes all indirect GHG emissions that occur in our value chain. These emissions are a result of activities that are not owned or controlled by us but are associated with our services and activities. Our Scope 3 emissions include only upstream emissions from purchased goods and services (category 1)[i], capital goods (category 2), waste generated in operations (category 5), business travel (category 6), employee commuting (category 7), and leased assets (category 8).
These emissions are the largest and most challenging to measure and manage, but they are important to understand the full carbon footprint of our organisation and our impact on climate change. The TAUW Group had no material downstream emissions in 2023. Lastly, Scope 3 emissions for the TAUW Group in 2023 were 21,731 t CO2 e. To reduce our Scope 3 emissions further, we will intensify our talks with suppliers, business partners and clients, elaborate on our reduction pathway for all TAUW entities and align it with the climate target to be far below 1.5°C.
[i] For Scope 3, categories 1 and 2, we have used spend based analysis. Spend-based analysis involves estimating GHG emissions based on financial expenditures, such as the amount of money spent on purchased goods and services. This approach assumes that the amount of money spent is directly proportional to the GHG emissions generated. It estimates emissions, but may not always accurately reflect the exact emissions. In the future, we will continue to refine our methodology and, where possible, use direct emissions data (hybrid methodology).
The scope 3 emissions in tons CO2 e involved in the following categories:
Category 1
Purchased goods and services
Category 2
Capital goods
Category 3
Fuel and energy related activities
Category 4
Waste from own operations
Category 6
Business travel
Category 7
Employee commuting
Category 8
Leased assets

Purchased goods and services (Scope 3, category 1)
Scope 3 category 1 includes all the services and products we need to provide our services and maintain our business. 64% of TAUW’s total carbon footprint falls into this category. Of this, 36% is related to internet services, 31% to office products, 10% to education, 9% to drilling and construction, 6% to laboratories, 4% to computer-dependent services, and 1% each to textiles, chemicals, rubber and plastic products, and recreational, cultural and sporting services.
Capital goods (Scope 3, category 2)
Scope 3 category 2, capital goods, accounts for 13% of TAUW’s total carbon footprint. Of this, 58% is related to real estate maintenance, 30% to machinery and equipment, 11% to security services and 1% to the sale of motor vehicles and accessories.
Waste generated in own operations (Scope 3, category 5)
Scope 3 category 5, waste generated by our operations, represents 5% of TAUW’s total carbon footprint. Of this, 89% is soil and groundwater remediation waste, 7% is office waste and 4% is other waste, e.g. from environmental measurements.
Sustainable mobility and vitality (Scope 3, categories 6 and 7)
Recognising the broad impact of travel choices, we have taken a multi-faceted approach to reducing travel emissions across our sites. This includes financial incentives for electric vehicles and public transport, encouraging active commuting such as cycling and walking, and only flying for journeys over 800km. Building on our experience during the pandemic, we have introduced a hybrid working protocol. We are also actively converting our company fleet to electric vehicles, while promoting greener commuting options and flexible working arrangements.
Sustainable services and activities (related to our entire value chain)
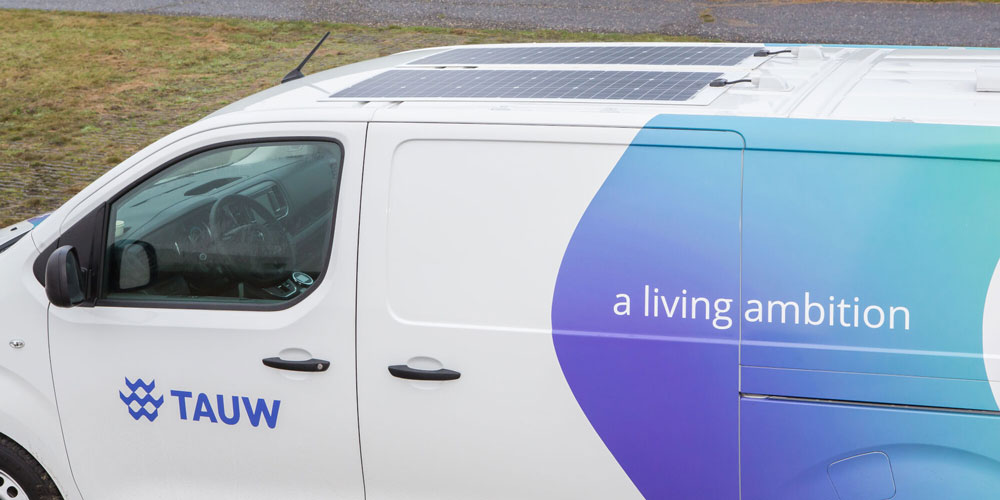
In our soil activities – soil remediation, soil surveys and groundwater projects – we already use sustainability indicators at every stage of the remediation process, assessing not only the obvious indicators such as health and safety and remediation costs, but also participation, carbon footprint, impact on biodiversity, impact on reputation and increase in site value. Where possible, we use nature-based technologies, such as the use of micro-organisms, plants and natural materials and processes, to minimise environmental impact. We aim to reduce waste and minimise the use of energy, materials and chemicals. Some of the measures we take are: optimising project planning to reduce field survey travel, replacing our vehicle fleet with electric cars and vans, using sustainable and biodegradable soap to clean drilling equipment and using biodegradable sounding pipes.
Total carbon footprint
The total carbon footprint of the TAUW Group in 2023 is 22,162 t CO2 e. As an environmental engineering consultancy, we are well aware of that 97% falls within our upstream value chain. Our GHG emissions intensity per employee is 0.4 t CO2 e/ FTE in Scopes 1 and 2; 18.3 CO2 e/ FTE in Scope 3; and 18.7 CO2 e/ FTE in all scopes. Our GHG emissions intensity per turnover is 138 t CO2 e/ mio € and per EBITA 2,287 t CO2 e/ mio €.
[i] t CO2 e = tonnes of carbon dioxide equivalent